
Market Analysis Built For Fast Visual Reads
BASALT Charts turns futures order flow, market profiles, volume, momentum, and context into a calm browser-based workflow designed for short-term analysis.
From Market Shape To Trade Confirmation
Start with visual futures order flow, add footprint-style cluster statistics, TPO and Volume Profiles, CVD, and persistent volume zones, then layer momentum and trend indicators when they help.
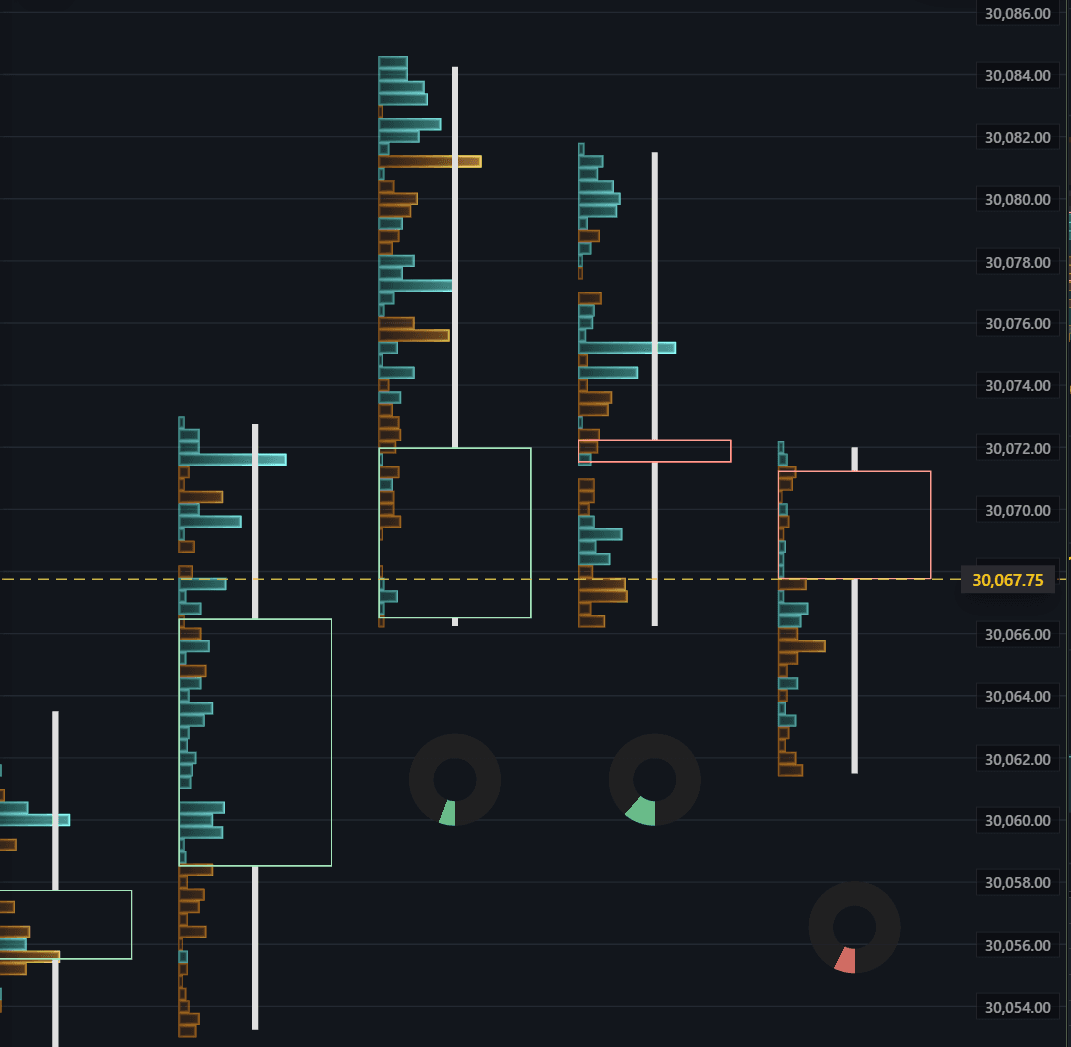
Trade Heatmap
Cluster trade activity by price level using depth and spatial structure so volume concentration, rejection areas, and pressure zones are easier to inspect.
- Switch between total volume, buy volume, sell volume, and delta views.
- Spot where activity builds around wicks, stalls, and rejection zones.
TPO Profile And Volume Profile
Compare time-at-price with traded volume using TPO Profile (Market Profile) and Volume Profile tools. Fixed and continual ranges help reveal where a futures market has spent time, accepted volume, and built session structure.
- Mark the Point of Control (POC), the profile price with the greatest activity.
- Show Value Area High (VAH) and Value Area Low (VAL) around the configured value area.
- Use fixed or continual Volume Profiles with buy/sell and delta rows, or TPO profiles with draggable ranges.
Cumulative Volume Delta (CVD)
Cumulative Volume Delta (CVD) tracks the running difference between aggressive buy and sell volume across the session, giving futures traders another way to compare price movement with participation.
- Inspect whether cumulative buying or selling pressure is expanding, flattening, or diverging from price.
- Reset the calculation by session and review available coverage reporting.
- Use CVD beside footprint-style cluster data, delta views, and the Trade Heatmap rather than as a standalone signal.
Volume Cluster Statistics
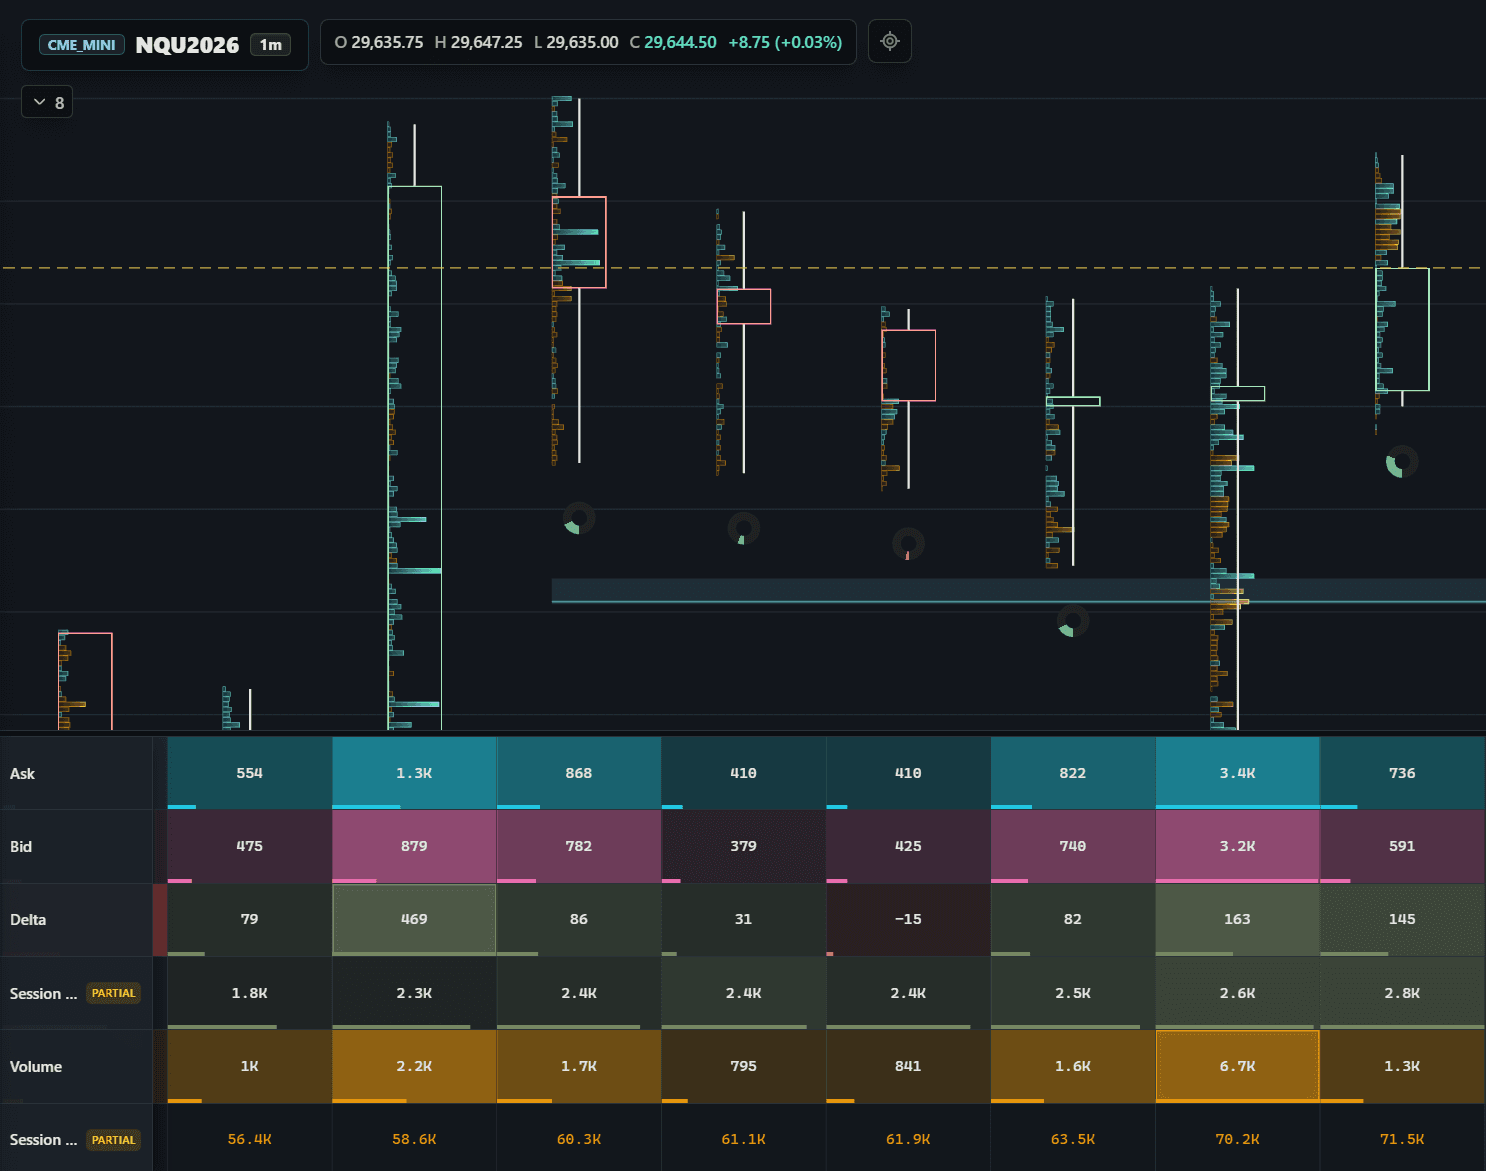
Keep the numerical evidence beneath the chart when you need a more exact read. Volume Cluster Statistics align each candle with its ask, bid, delta, volume, and session-running context.
- Compare ask and bid activity candle by candle without leaving the chart.
- Scan delta and total volume alongside the price structure they belong to.
- Use the statistics panel as a precise companion to BASALT's visual volume cues.
Volume Zones
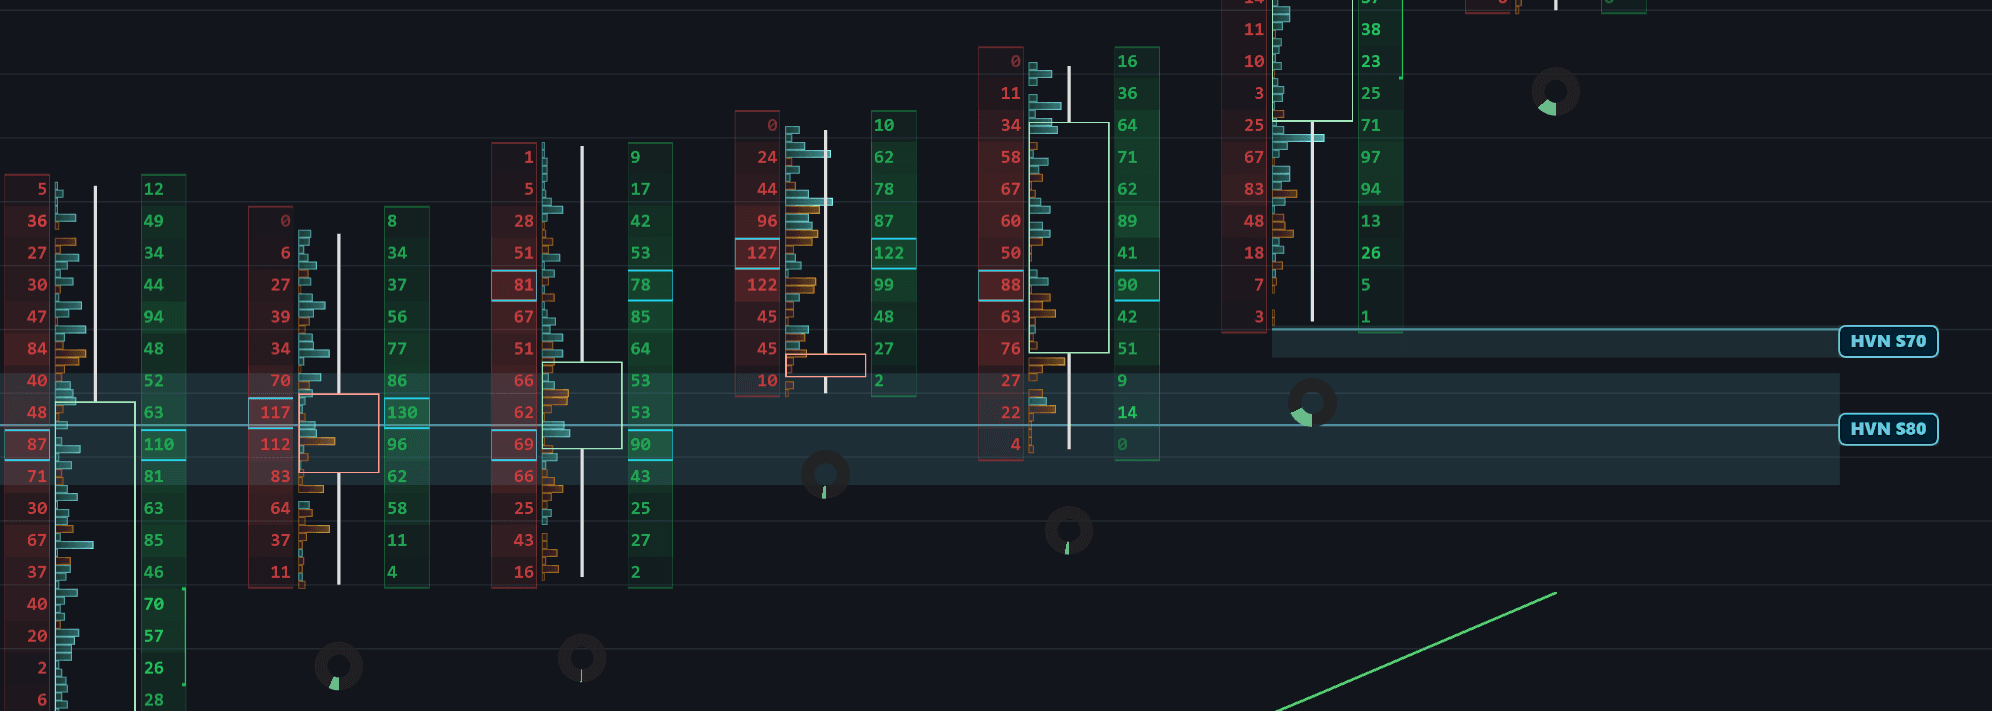
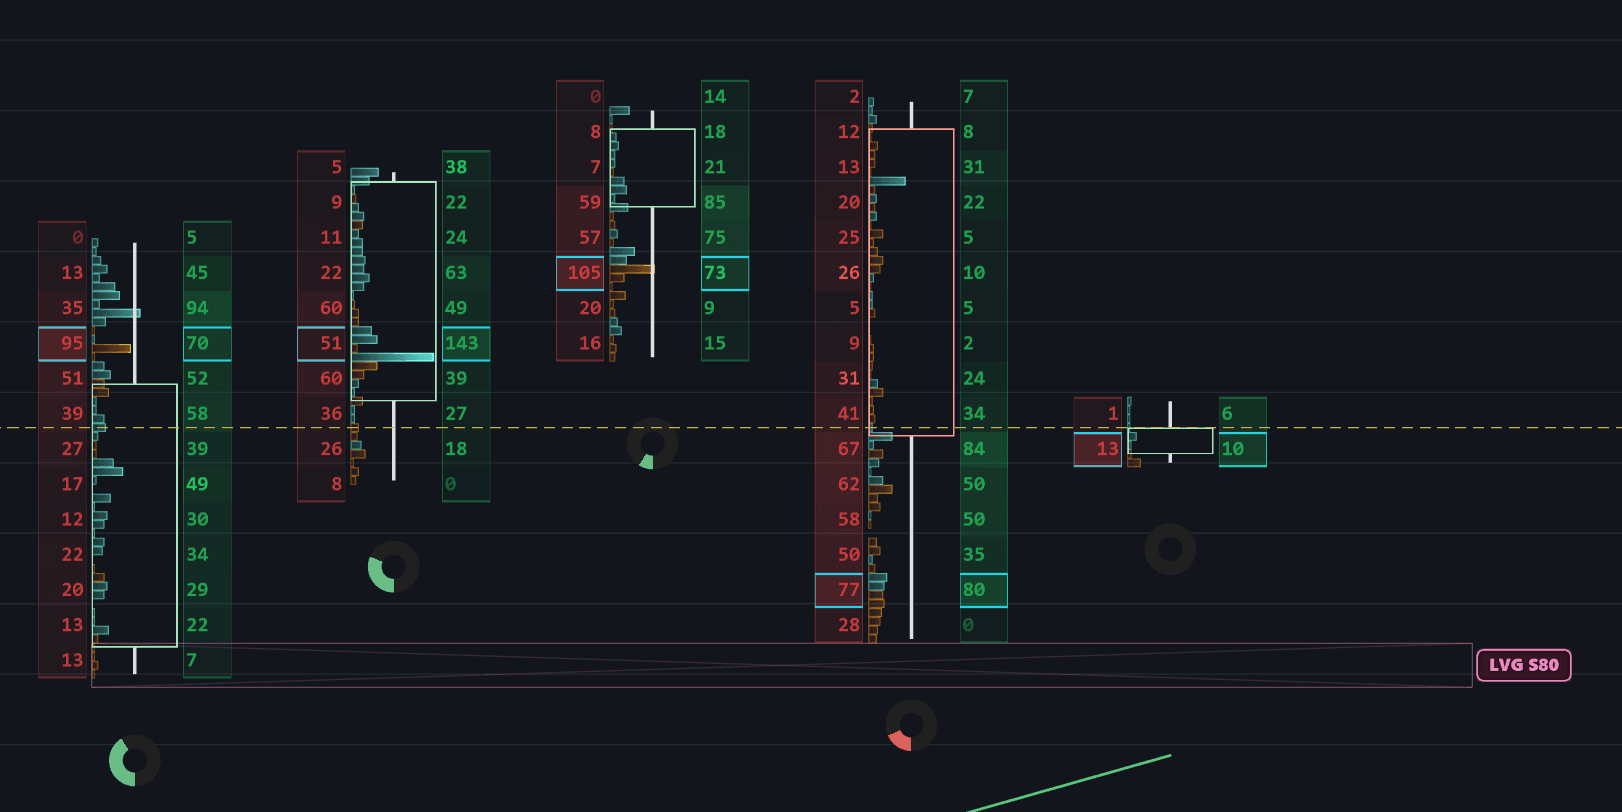
Carry meaningful volume structure forward across the chart. BASALT marks High Volume Nodes and Low Volume Gaps as labeled zones so important acceptance and low-participation areas remain visible as price develops.
- Highlight High Volume Nodes where activity has concentrated around a price area.
- Mark Low Volume Gaps where comparatively little activity traded through the range.
- Keep each zone labeled on the chart instead of rebuilding the level from memory.
Wick Absorption Indicator
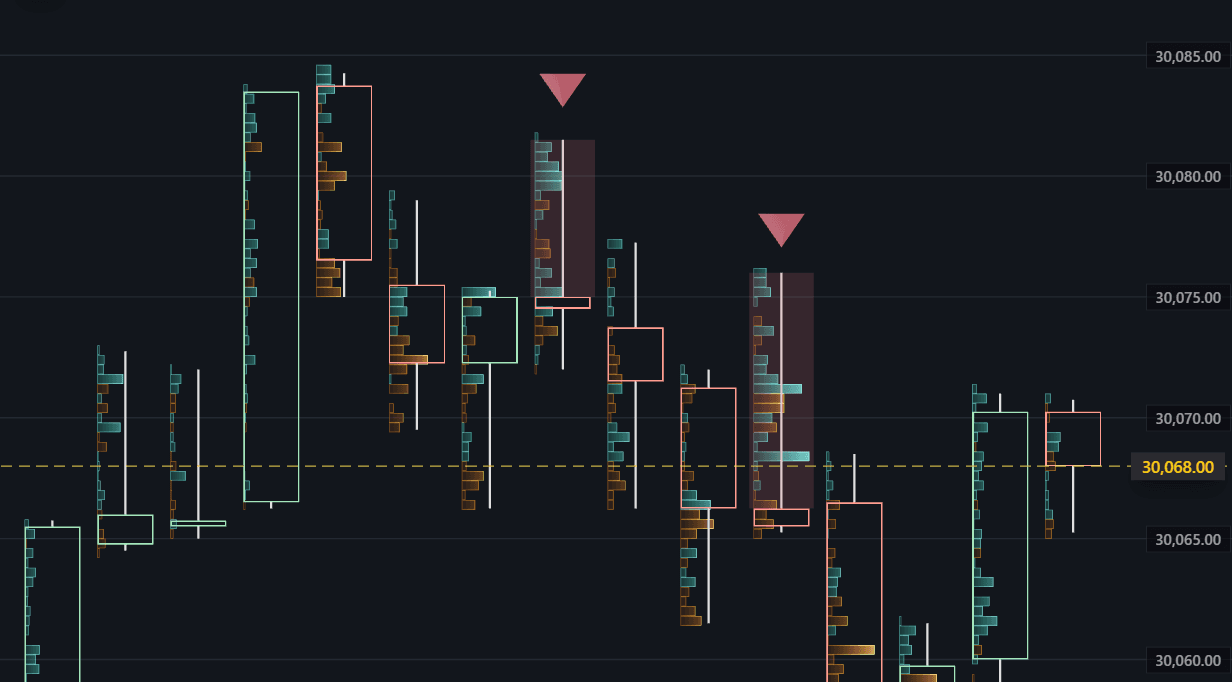
Highlight wick areas where aggressive buying or selling appears to be absorbed and rejected, leaving a visible zone on the chart.
- Detect bullish lower-wick and bearish upper-wick absorption patterns.
- Use price-level volume, wick volume share, aggression, contrary delta, and close rejection.
- Display configurable zones and markers directly on the candles.
Market Regime Indicator
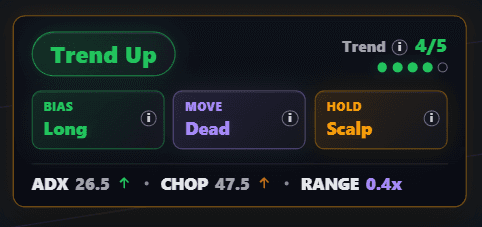
Summarize whether the market is trending, chopping, transitioning, expanding, or exhausted before you commit attention to a setup.
- Classify regime, directional bias, movement state, and hold mode.
- Combine ADX, CHOP, VWAP, EMA, range expansion, and pullback control.
- Use a simple trend quality score to see when context is aligned.
Market Sentiment Indicator
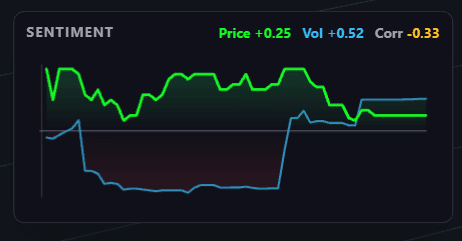
Compare price direction against volume delta as the active bar develops, making agreement, divergence, and fading conviction easier to see.
- Track price direction and volume delta through the active candle.
- Surface whether price and volume are confirming or disagreeing.
- Show correlation over the visible live history window.
Volume Tick Visualizer
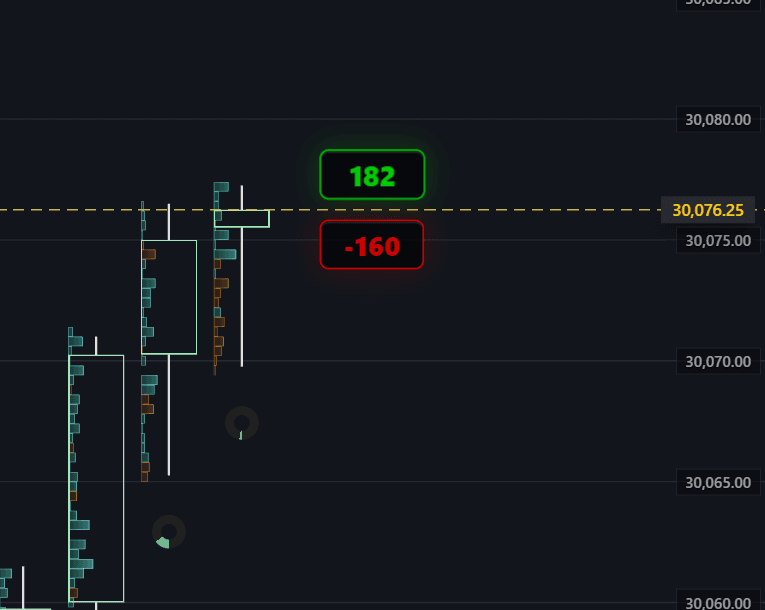
Show live buy and sell tick volume near the active candle so the latest push is visible while the current bar is still forming.
- Use split buy/sell numbers or a combined delta-style read.
- Keep the latest classified activity next to the active candle.
- Clear numbers by candle duration or after a configurable activity timeout.
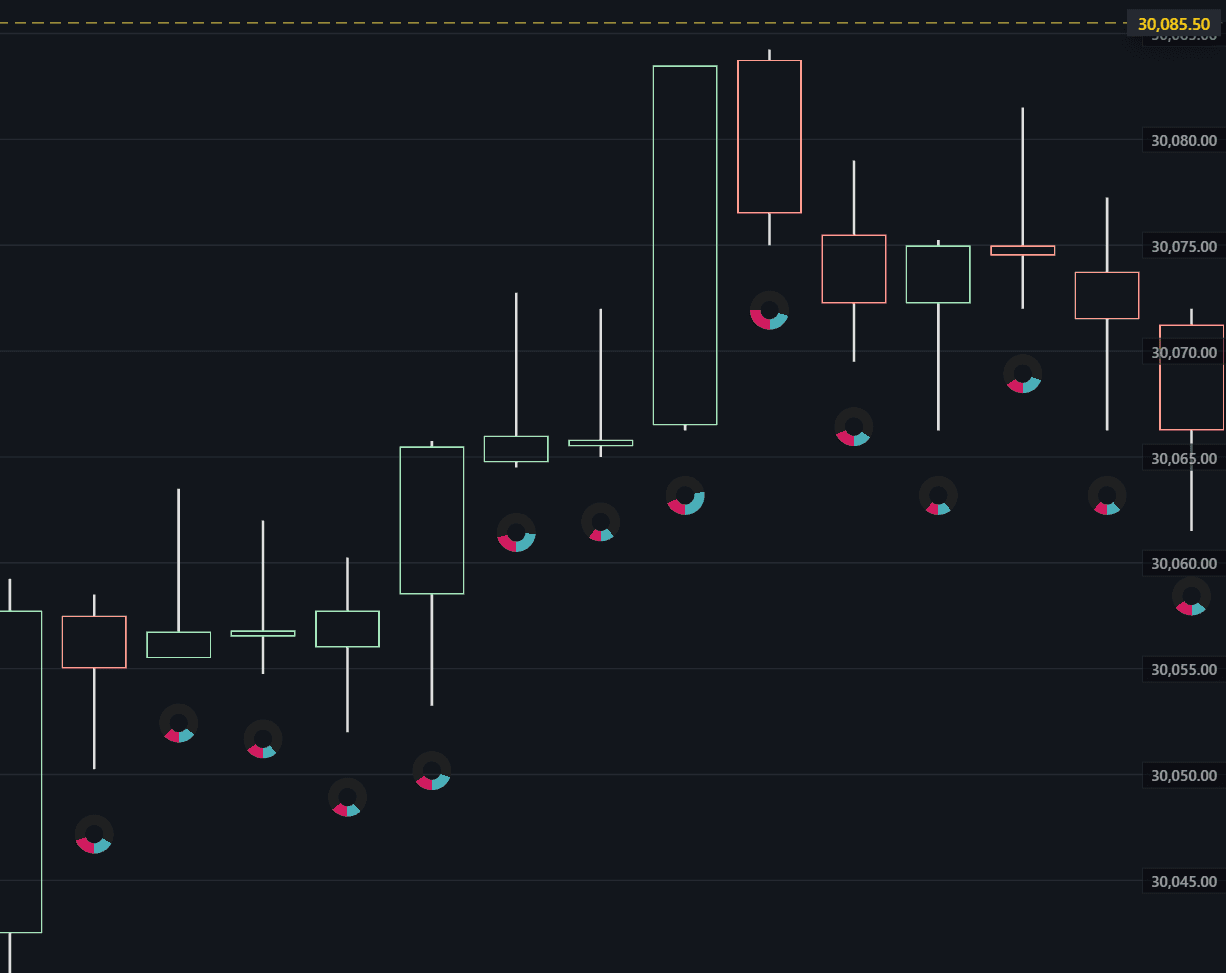
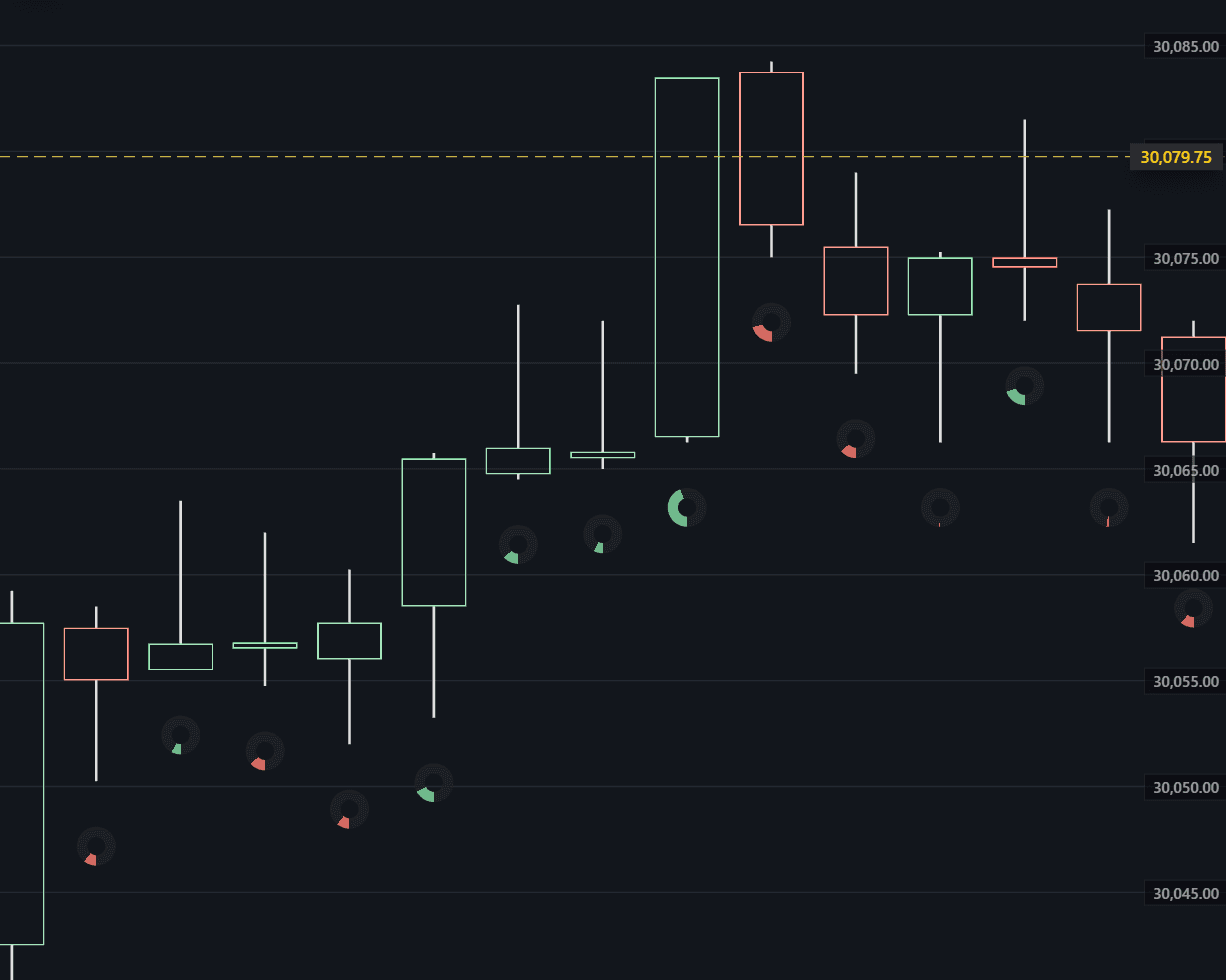
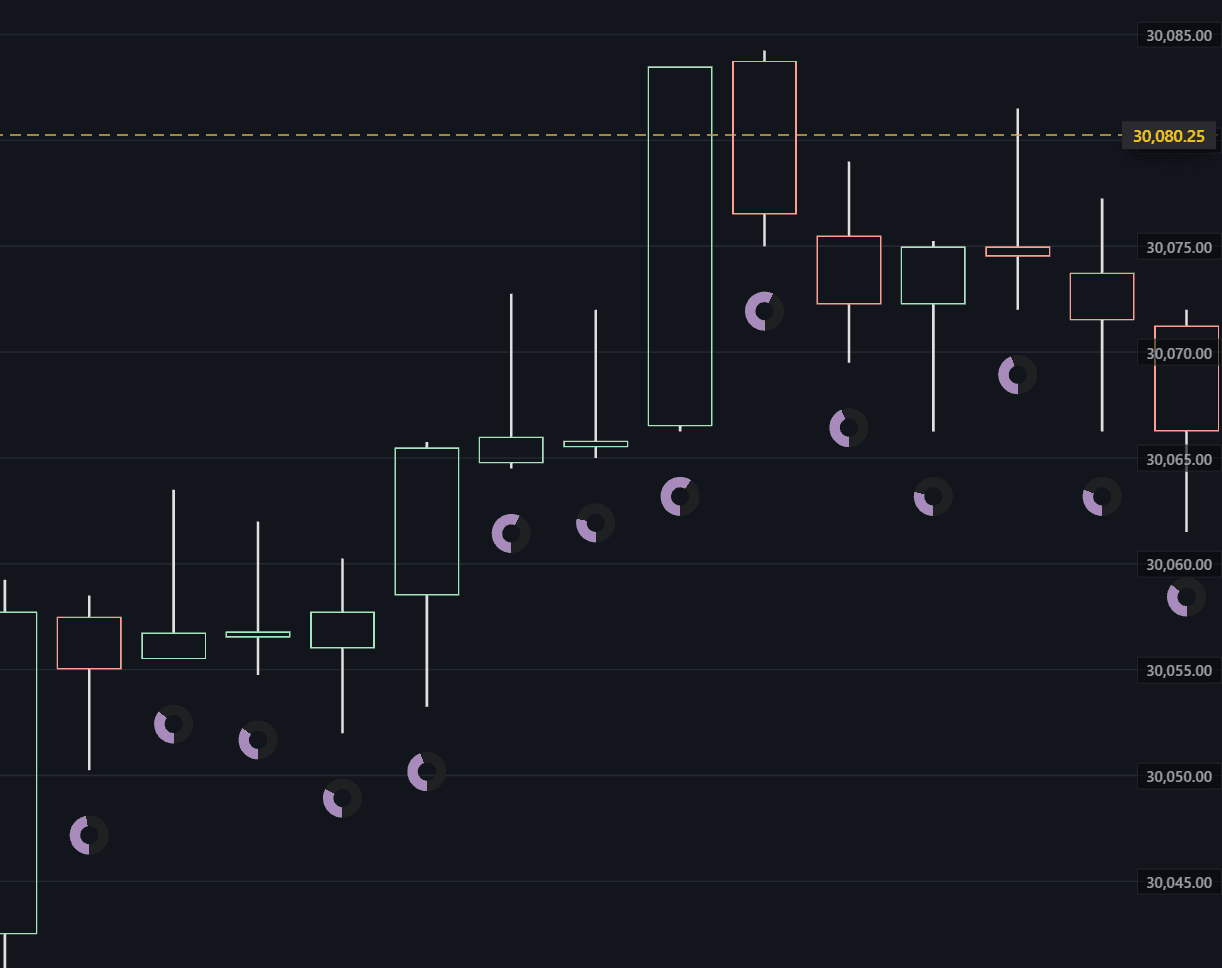
Candlestick Volume Visualizers
Attach volume rings directly to candlesticks so total volume, buy/sell pressure, and delta stay close to the price action they explain.
- Read total volume, buy/sell volume, or volume delta without opening a separate panel.
- Use global or recent-window scaling to compare activity across visible candles.
- Keep volume context attached to the candle instead of separated below the chart.
Gauge Indicators
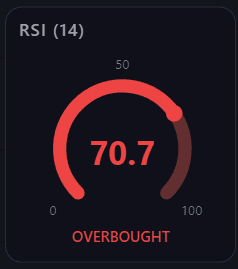
Use compact gauge-style indicators for familiar context without cluttering the main chart surface.
- RSI Gauge helps show momentum stretch.
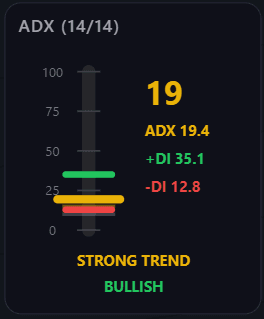
- ADX Gauge helps show trend strength.
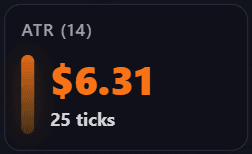
- ATR Gauge helps show range and volatility context.
RSI, MACD, And Supertrend
Add familiar technical context with configurable Relative Strength Index (RSI), Moving Average Convergence Divergence (MACD), and Supertrend indicators alongside BASALT Charts' order-flow tools.
- Use traditional RSI and MACD lower panes with labeled automatic or manual value-axis scaling.
- Overlay Supertrend on price to inspect directional trend context.
- Move, collapse, maximize, resize, or remove lower indicator panes as the workspace changes.
Indicator Library
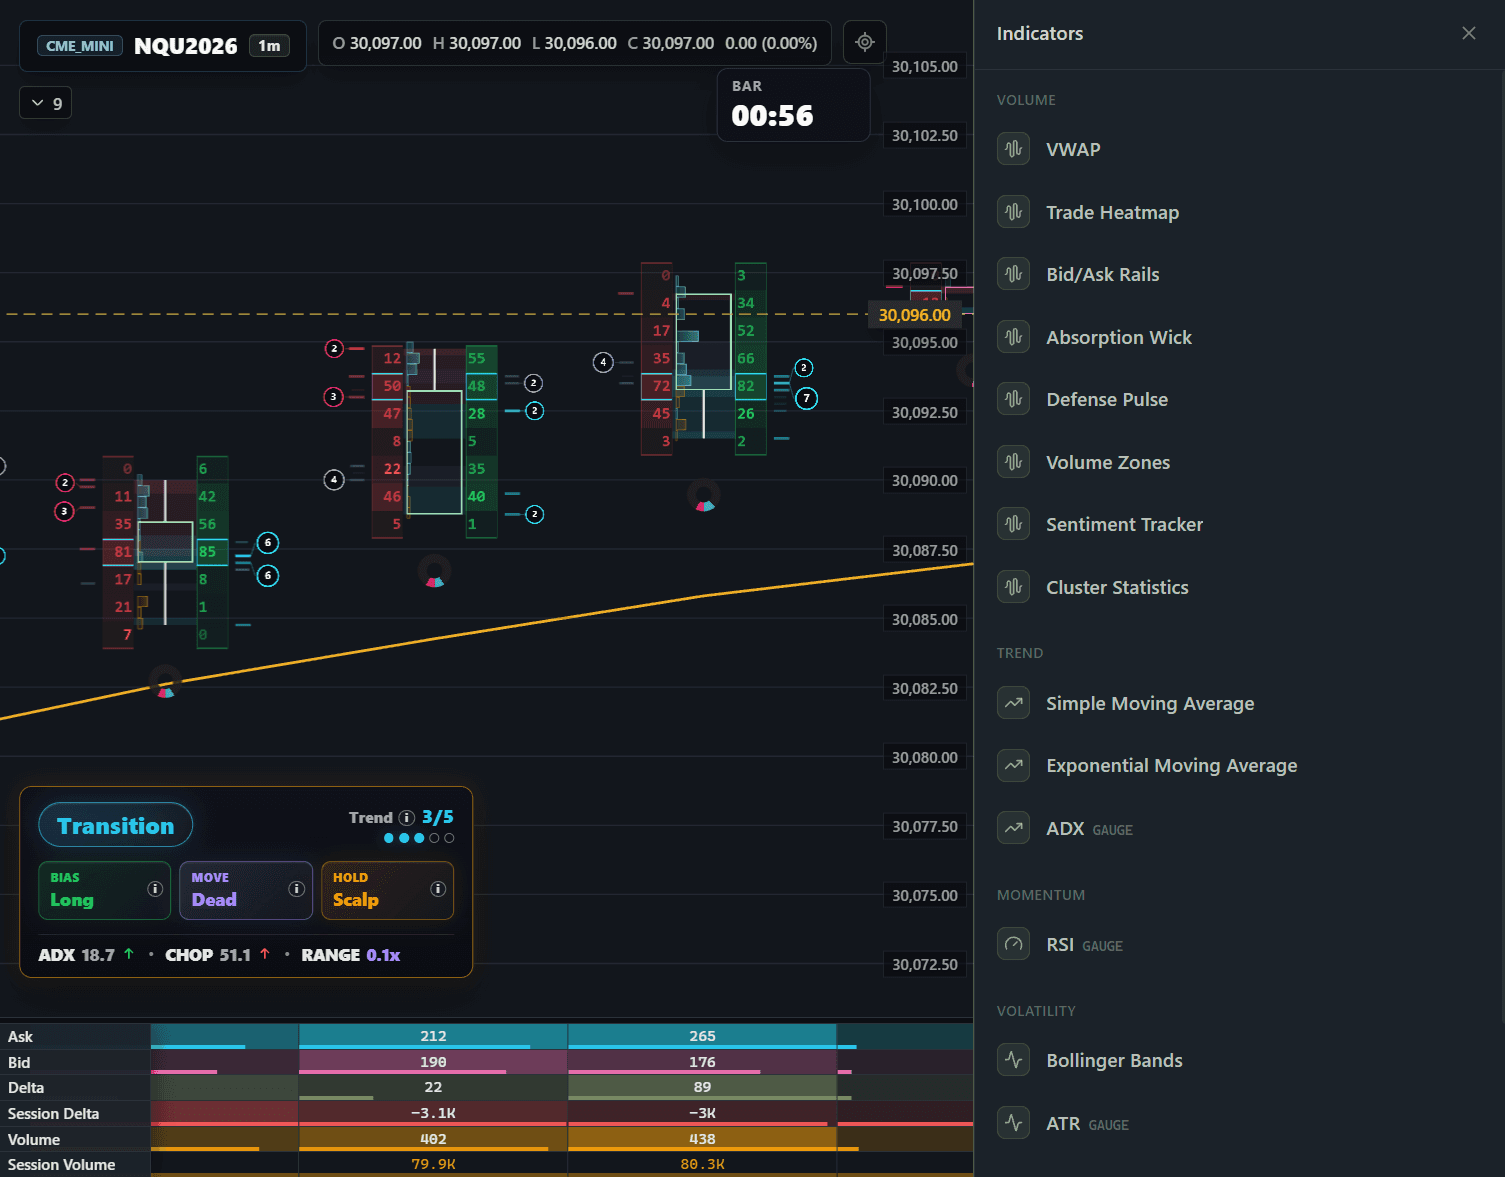
Browse BASALT's order-flow, trend, momentum, and volatility tools from one categorized drawer without leaving the live chart.
- Find Trade Heatmap, Bid/Ask Rails, Wick Absorption, Volume Zones, Sentiment, and Cluster Statistics together.
- Move quickly between volume, trend, momentum, and volatility categories.
- Use up to 10 indicators per chart on Advanced or unlimited indicators on Max.
Real-Time Newsfeed
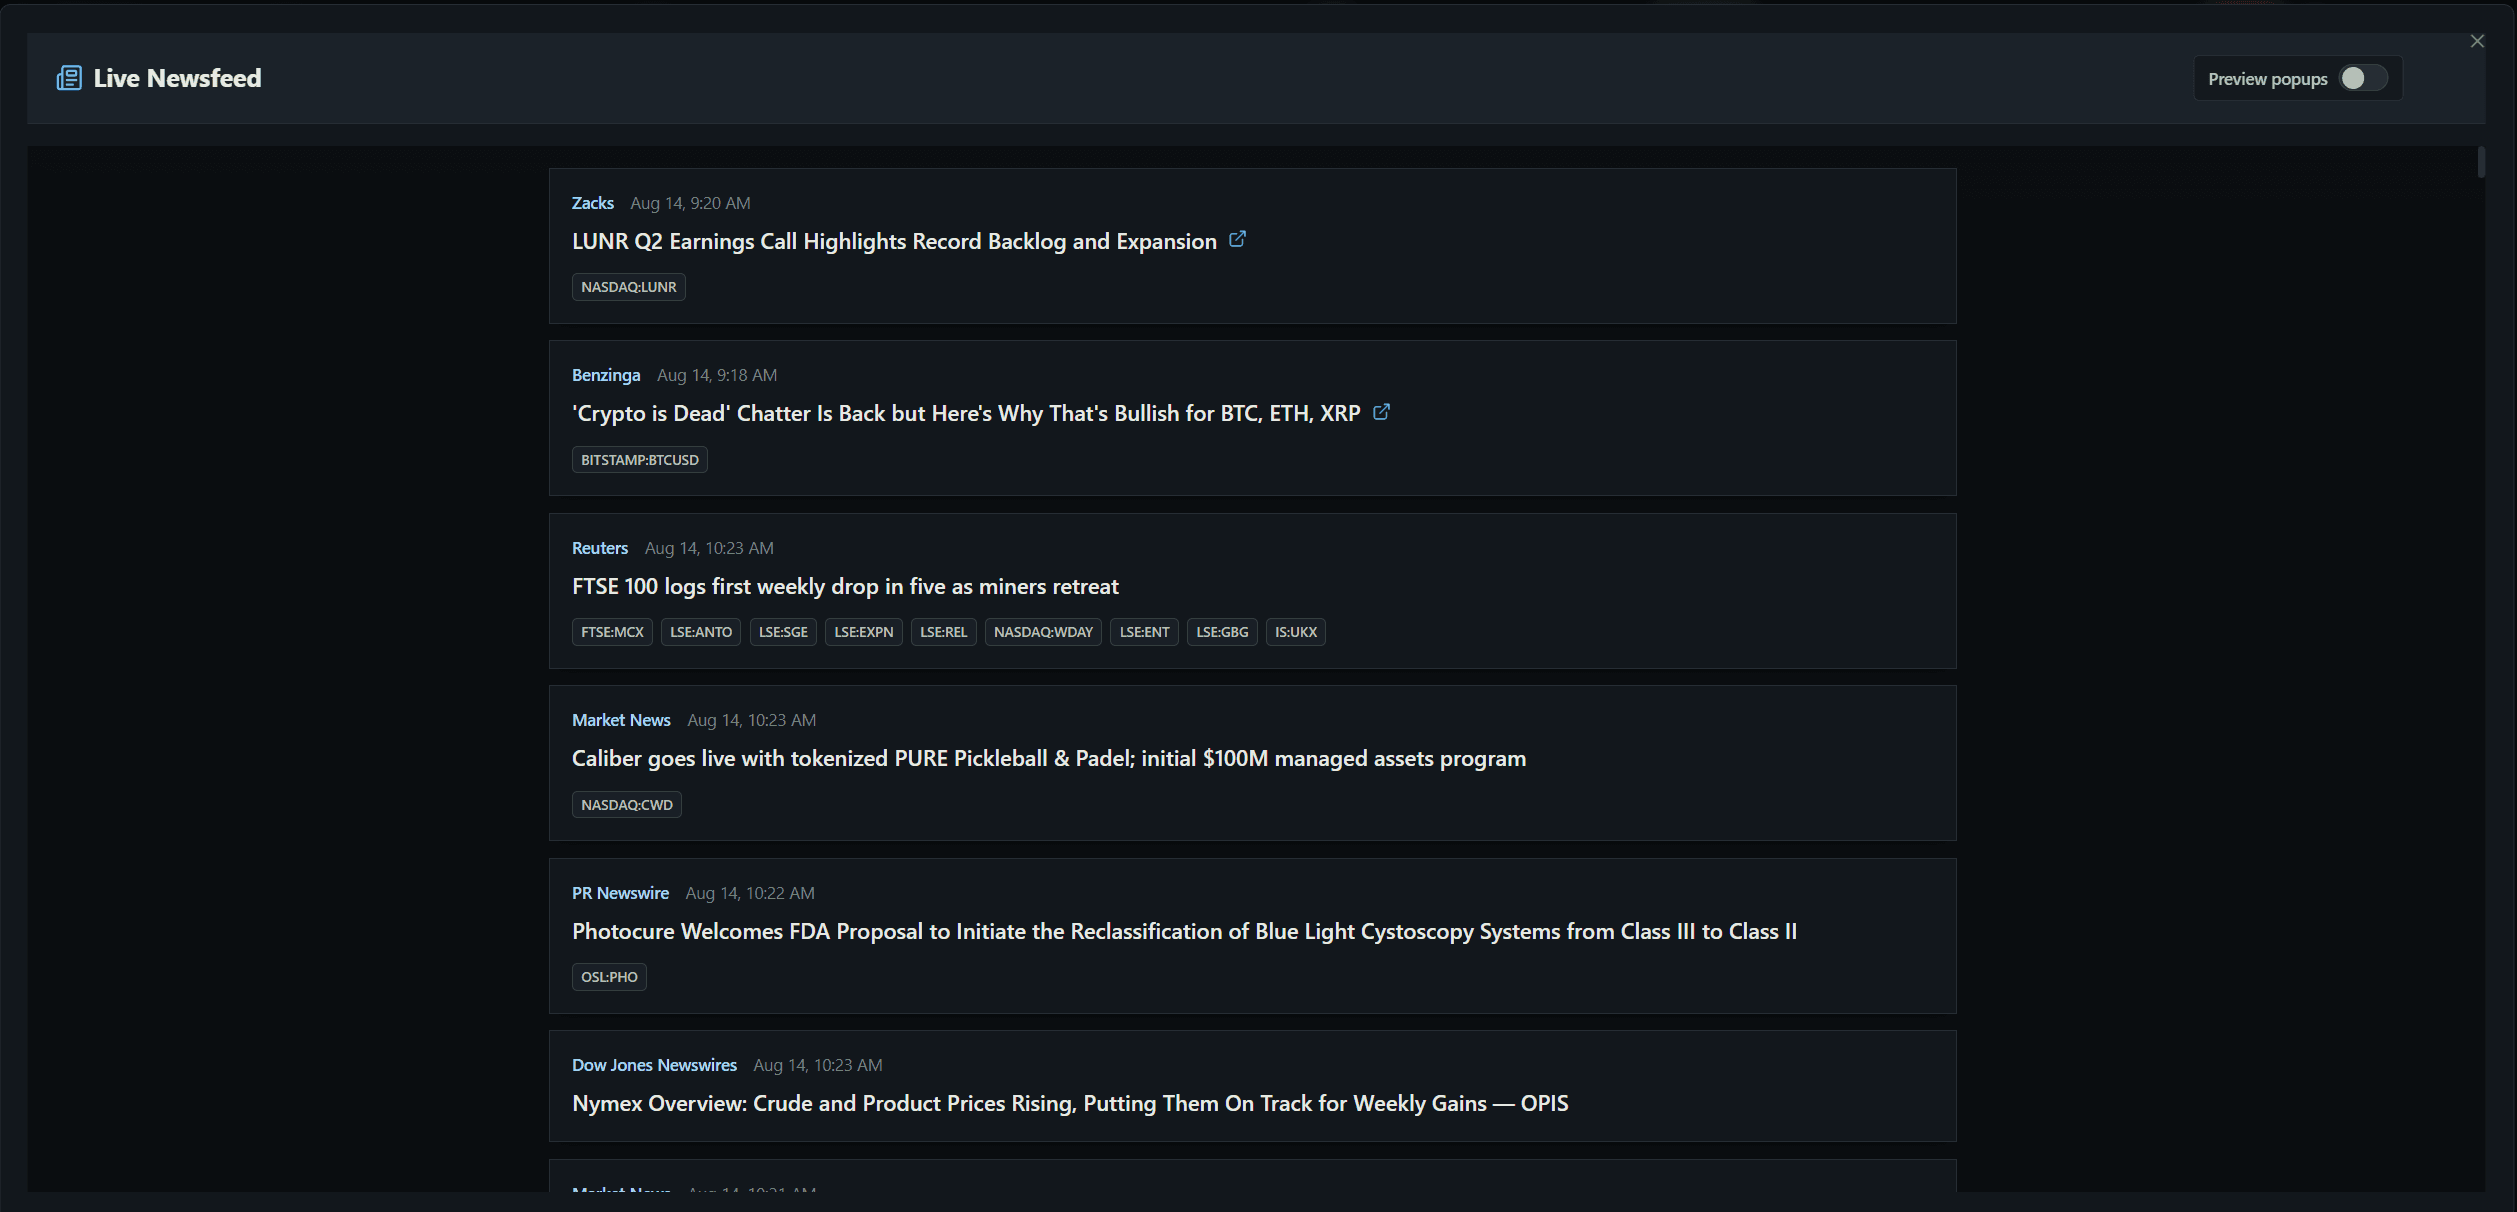
Keep current market headlines close to the chart with a dedicated newsfeed available on the Max plan.
- Scan the source, publication time, and headline in a focused feed.
- Use instrument tags to see which markets a story references.
- Turn preview popups on or off to match your preferred level of interruption.
Market Data Included
Paid plans include real-time exchange market data with rapid tick-based updates over WebSockets, so you can spend less time wiring up feeds and more time reading the chart.
Read more about how futures market data is included or explore the complete futures order-flow software workflow.
Choose The Workspace Limits That Fit Your Flow
Advanced includes the core BASALT Charts feature set. Max keeps the same foundation and adds the least restrictive workspace limits plus real-time news updates.
The Fastest Way To Understand BASALT Is To Launch It
Open the live NQ or SOLUSDT demo and explore the charting experience directly. No account, credit card, or download required for the demo.