Visual Order Flow Software for Futures Traders
BASALT Charts is browser-based futures order-flow software for visualizing traded volume, market pressure, delta, absorption, profiles, and market context. It supports analysis of futures such as NQ and ES, with real-time market data included on paid plans.
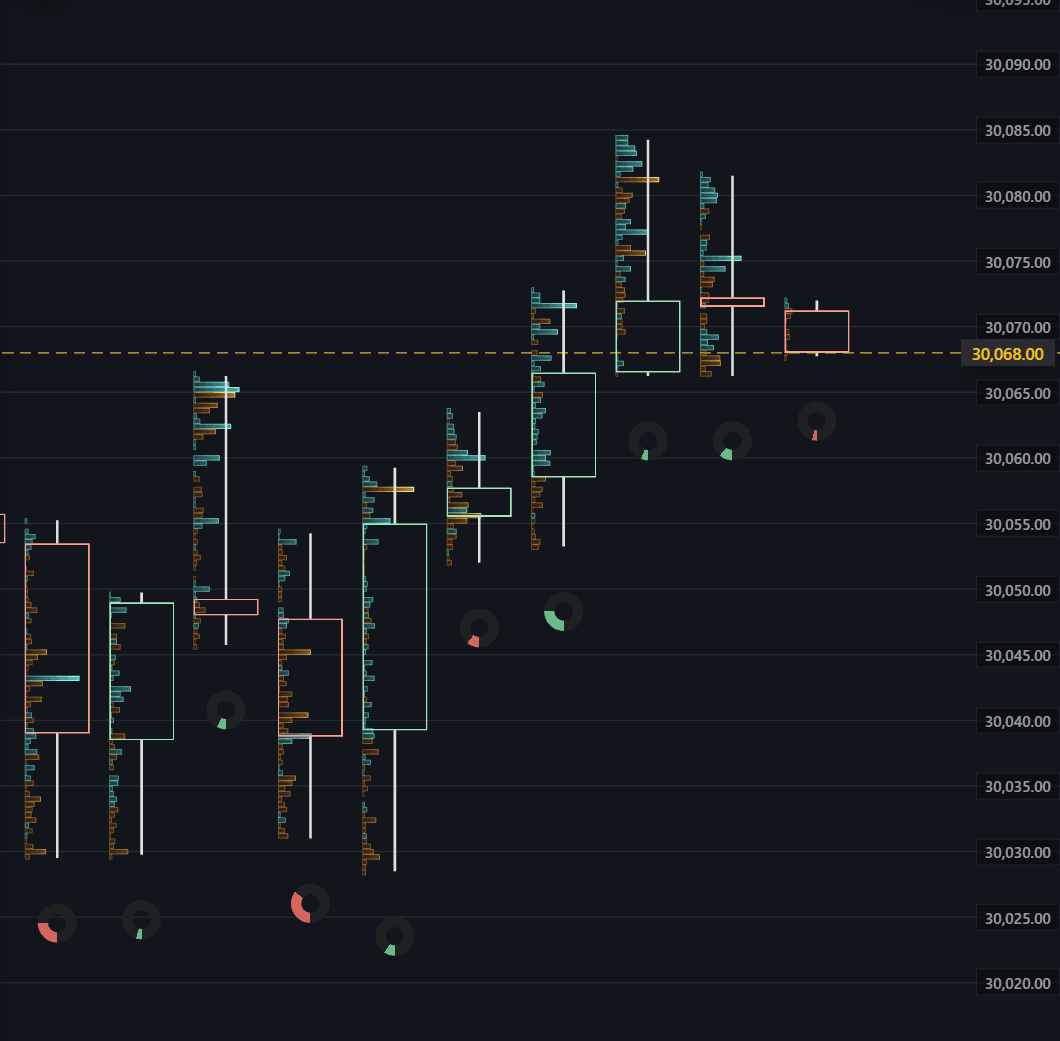
Order-Flow Charts Without A Wall Of Numbers
Order flow describes executed buying and selling around price. BASALT Charts keeps that evidence crawlable and understandable: spatial visuals provide the fast read, while cluster statistics provide bid, ask, volume, and delta detail.
Trade Heatmap
See where traded volume and order-flow pressure concentrate around price as visual depth and spatial structure.
Learn about the Trade HeatmapFootprint-style cluster data
Compare bid, ask, delta, volume, and session-running totals candle by candle when an exact numerical read matters.
Explore order-flow featuresDelta and absorption
Inspect aggressive buying and selling, then look for wick areas where pressure appears to stall, absorb, or reject.
See delta and absorption tools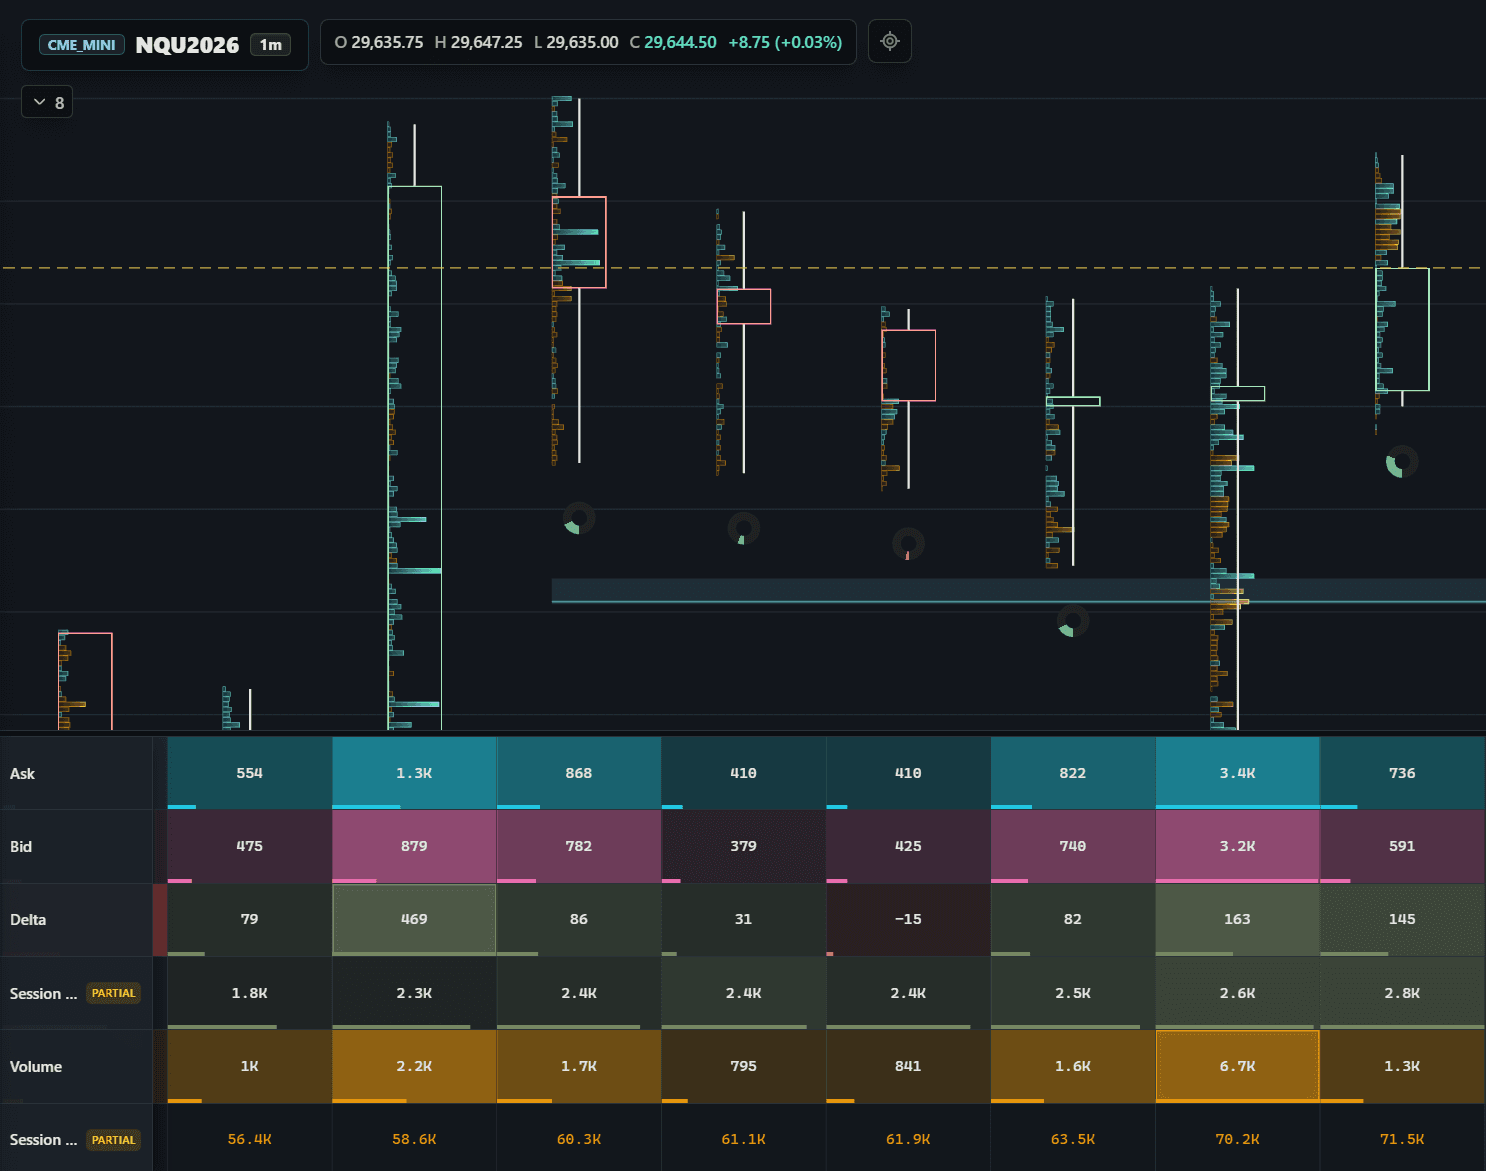
Heatmap, Footprint Data, CVD, And Absorption
The Trade Heatmap shows where activity clusters around price. Footprint-style Volume Cluster Statistics expose bid, ask, delta, volume, and session totals; Cumulative Volume Delta (CVD) tracks the running balance of aggressive buy and sell volume; wick absorption highlights areas where pressure appears to be rejected.
- Compare price movement with session-based CVD.
- Switch Trade Heatmap views between total, buy, sell, and delta activity.
- Use absorption as context, not as a promise or standalone trade signal.
TPO Profile, Volume Profile, POC, And Value Area
TPO Profile—also called Market Profile—organizes time spent at price. Volume Profile organizes traded volume by price. BASALT Charts provides fixed and continual profile ranges with Point of Control (POC), Value Area High (VAH), Value Area Low (VAL), and, where relevant, buy/sell and delta rows.
Profiles describe where the auction developed; they do not predict an outcome. Combine them with current order flow and broader market context.
See TPO and Volume Profile featuresBrowser-Based Futures Charts
BASALT Charts runs in a modern desktop browser with no desktop installation. Keep it beside a broker or prop-firm execution platform while analysis and order placement remain separate.
Compare BASALT Charts with BookmapFutures Market Data Included
Paid plans include real-time exchange market data with rapid tick-based updates. Coverage varies by market or instrument, and the free demos provide live NQ (1m) or Bybit SOLUSDT perpetual futures (5m) data.
Learn how futures market data is includedFutures Order-Flow Software Questions
What is futures order-flow software?
Futures order-flow software visualizes how buying and selling activity develops around price. BASALT Charts combines heatmaps, footprint-style cluster statistics, delta, profiles, absorption, and market context in a browser-based analysis workspace.
Does BASALT Charts include footprint charts?
BASALT Charts provides footprint-style bid, ask, delta, and volume evidence through Volume Cluster Statistics and chart overlays. Its Trade Heatmap emphasizes spatial order-flow patterns rather than presenting only a dense grid of numbers.
What profiles are available?
BASALT Charts includes TPO Profile, commonly called Market Profile, plus fixed and continual Volume Profiles. Profile tools can show Point of Control, Value Area High, Value Area Low, buy and sell volume, and delta rows.
Can I use BASALT Charts for NQ and ES futures?
BASALT Charts supports futures analysis including NQ and ES within available market-data coverage. The free browser demos offer live NQ (1m) and Bybit SOLUSDT perpetual futures (5m) data so traders can inspect the workflow before subscribing.
Does BASALT Charts place trades?
No. BASALT Charts is analysis software, not a broker or execution platform. Traders can run it beside their broker or prop-firm platform and keep order placement in that platform.